37 Stocks
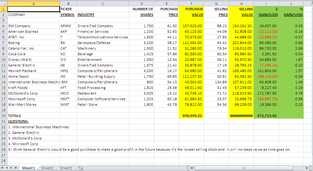
During this assignment I had to create a spreadsheet in Excel to determine an investor's gains/losses from the purchase and sale of stocks. The technology skills I used to complete this assignment was knowing how to format column widths, using the AutFill feature, formating cells to negative numbers, and changing a cells fill color. Also, a new skill I learned was changing negative numbers to red and displaying them with parentheses. Another skills was learning and being familar with equations to determine purchase value, selling value, $ through gain/loss, and % through gain/loss. Looking back I feel as I did well on following directions and inputing all the correct info/formatting to complete the assignment as displayed. However, in order to go above and beyond I could have made the table more appealing with the different formatting options Excel offers.
Excel #22
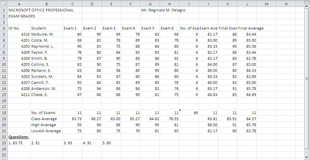
In the Excel 22 activity I had to recreate a spreadsheet creating a chart with students exam grades to practice the different formula features, such as calculating the number of exams and many types of averages. The technology skills I used in order to complete this assignment were the average feature, the max and min feature, knowing how to use final average formula, the AutoFill feature, and the count feature. Through this assingment I've learned how to insert the count feature to make it faster to find the total. Also I've learned how to find the final average by adding the final exam average by exam average twice and dividing all of it by 3. The reason for adding the exam average twice was because it was worth 2/3 and the final exam is worth 1/3. I think I did well on inserting the formulas correctly and using the AutoFill feature to make it more efficient and faster. However, I could have done better on making the chart more appealing by changing the design and color of the chart.
Column Charts
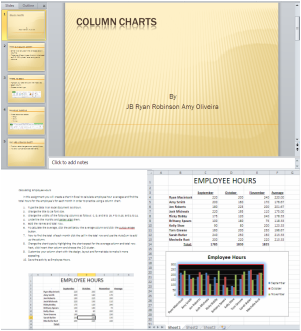
In this student directed group project, my group and I had to research and learn how to create a column chart in Excel and teach the class how to create this chart. When teaching the class we had to create a Power Point presentation to introduce the topic, demonstrate how to create it, and create a short practice activity. The technology skills we had to use in order to complete this assignment were knowing how to create a column chart, knowing the basics of Powerpoint, and how to use the snipping tool. I learned and accomplished many things during this assignment. Some of the things I learned was how to work productively and effectively in a group and being able to take the position of a teacher by teaching the class on a topic. Also I learned how to teach myself through various tutorials and put together a teacher lesson independently. Most importantly I learned how to create a column chart in Excel. I feel as though we did well on researching the topic to know all there is to know about column charts and creating a clear, to the point presentation/demonstration. We also did well on creating the activity part because the instructions were clear and the idea worked with the column chart. Although what we could have done better to improve on our work was go into detail a little more on showing the different options on formatting a column chart and adding the finish result picture of the column chart to the activity handout.
#50 Yacht Mortgage
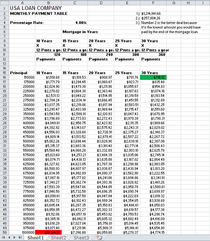
During this assignment, I had to create a spreadsheet in excel to calculate the yacht mortgages throughout the different years. The technology skills needed to complete this assignment were the PMT formula, AutoFill feature, how to shade a cell, and how to add borders. The PMT formula allowed us to calculate the payment for a loan based on constant payments and percentage rate(4.00%), which in this case was for a yacht. I have learned how to use excel to calculate mortgages by using the PMT formula. Not only have I learned how to insert this certain formula, but I have gained the skill to be able to find mortgages for future purposes when buying a house, car, etc. I feel as though I overall I did well on this assignment because I followed the directions and successfully learned how to use the PMT formula and applied my pass experience with the AutoFill feature to efficiently accomplish the assignment. However, in order to improve on my work I could have understood and payed more attention to how the formula calculated the mortgages by inserting it, instead of wanting to just finish the assignment quickly.
